Observability (Metrics, Logs, Traces, APM)
Monitoring tells you that something is broken; observability tells you why. We build full-stack observability platforms that bring distributed tracing, structured logging and high-fidelity metrics together, so your engineers can resolve complex, microservice-level issues in minutes instead of hours.
What we deliver
End-to-end transaction visibility using OpenTelemetry (OTel), Jaeger, or Honeycomb. We instrument your code to track requests across language boundaries, microservices, and asynchronous message queues.
Moving from raw text to high-cardinality structured logs using Grafana Loki, ELK, or Datadog. We implement log correlation so that every log line is immediately linked to its corresponding trace ID.
Continuous profiling of application runtimes. We monitor code-level performance, SQL execution time, heap usage, and thread saturation to identify performance regressions before they hit production.
Working with your teams to define Service Level Indicators (SLIs) and Objectives (SLOs) that actually matter to the business. We build the dashboards and alerting around error budgets, not threshold noise.
Visibility into the actual user experience: front-end performance, Core Web Vitals, and client-side error tracking. We link RUM data to backend traces so you can follow an issue from the browser to the backend.
Engineering Prometheus/VictoriaMetrics clusters that handle millions of time series with deep dimensionality, allowing you to slice and dice performance data by customer ID, region, or build version.
How it works
Every engagement follows the same five steps: baseline the current state, design the target model, roll out in stages, operate it, and improve against measurements.
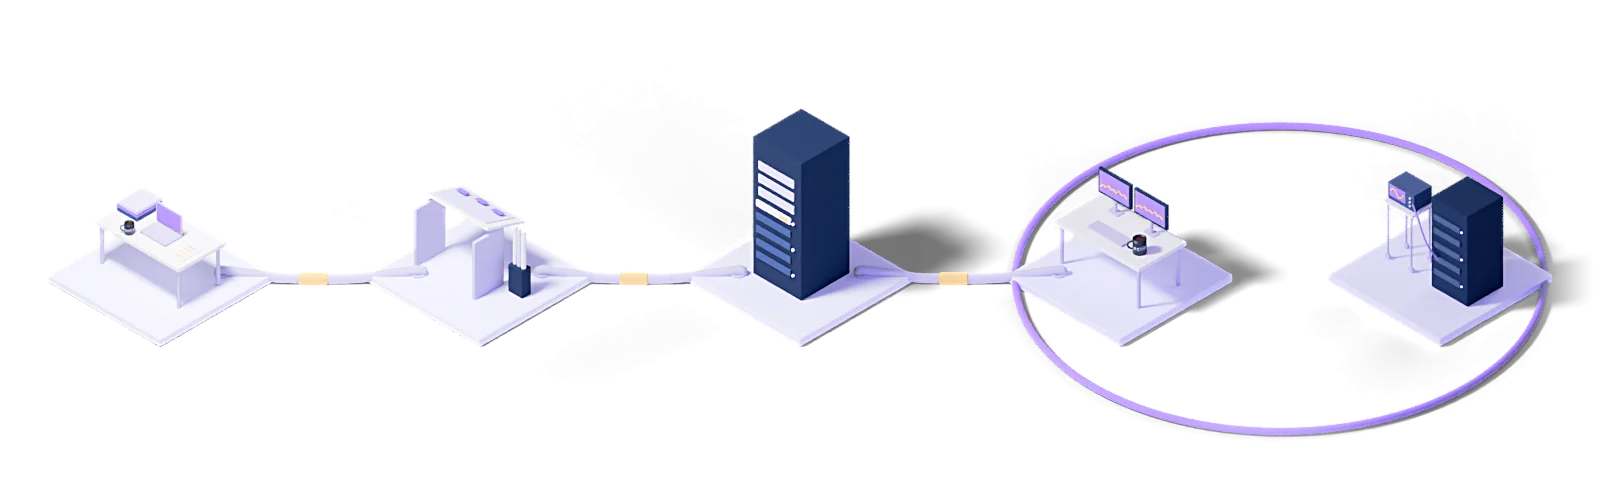
Assess
Baseline the current state, name the gaps and put the success criteria in writing.
Design
Architect the target operating model and the toolchain it needs.
Deploy
Implement, configure and validate in a staged rollout.
Operate
24/7 management with contracted response times and proactive monitoring.
Improve
Continuous improvement driven by metrics, incidents and changes in the business.
Every engagement runs under a written SLA: a commitment, not a best-effort promise.
Dedicated engineers who know your stack. No generalist help-desk tier in between.
Service reviews every two weeks, roadmap updates every quarter.
Who uses this
The industries we run Observability (Metrics, Logs, Traces, APM) for.
The technologies we run this on
The concepts behind this service
- Monitoring
- Continuous observation of systems, networks and applications.
- Continuous monitoring
- Uninterrupted observation of systems with automatic alerting on threshold breaches.
- Time to first byte (TTFB)
- The time between a request being sent and the first byte arriving.
This section explains the technical terms used on this page. The definitions come from Eclit's own technology glossary, and each term links through to its full entry there.
The full technology glossary →Knowledge Hub
What we have written about running and managing technology, collected in one place.
What Is APM? How Application Performance Monitoring Works
5 min readEveryone Runs Prometheus: So Why Do We Still Hear About Incidents Late?
4 min readReliability Friday 09: How Load Balancer Retries Multiply Backend Traffic
3 min readReliability Friday 01: How to Measure PostgreSQL Replication Lag
4 min readLog Retention Periods: Which Records to Keep and for How Long
4 min read01What is the difference between observability and monitoring?
Monitoring answers questions you already know to ask: is the server up, is the disk full. Observability lets you ask questions you did not anticipate: why was this request slow, which user group did it affect. The difference is being able to investigate a problem nobody defined in advance.
02Metrics, logs and traces: do we need all three?
They answer different questions. Metrics say how much, logs say what happened, traces say where it went. An organization collecting only logs cannot see which service the slowness started in; one collecting only metrics cannot see why.
03Do we need to change application code?
In most languages automatic instrumentation runs via an agent without code changes. Custom business metrics (basket value, transaction type) need a few lines in code, and those lines produce the most valuable data.
04Does data volume drive cost up sharply?
Sampling and retention tiers keep it under control. Not every request's trace needs full retention; failed and slow requests are kept in full and the rest sampled. Without that configuration, cost really does grow quickly.
05How fast do you reach root cause during an incident?
Minutes, if distributed tracing is in place. Without it the same analysis takes hours of comparing logs service by service. Shortening that time is observability's concrete return.
Let's work out where to start
Within two weeks you get it in writing: what works, what carries risk, and a prioritized roadmap.
Request a conversation