Centralized Logging & Telemetry
Centralized logging and telemetry. Records collected in one place, their integrity preserved, retention driven by policy, and every record retrievable on request.
What we deliver
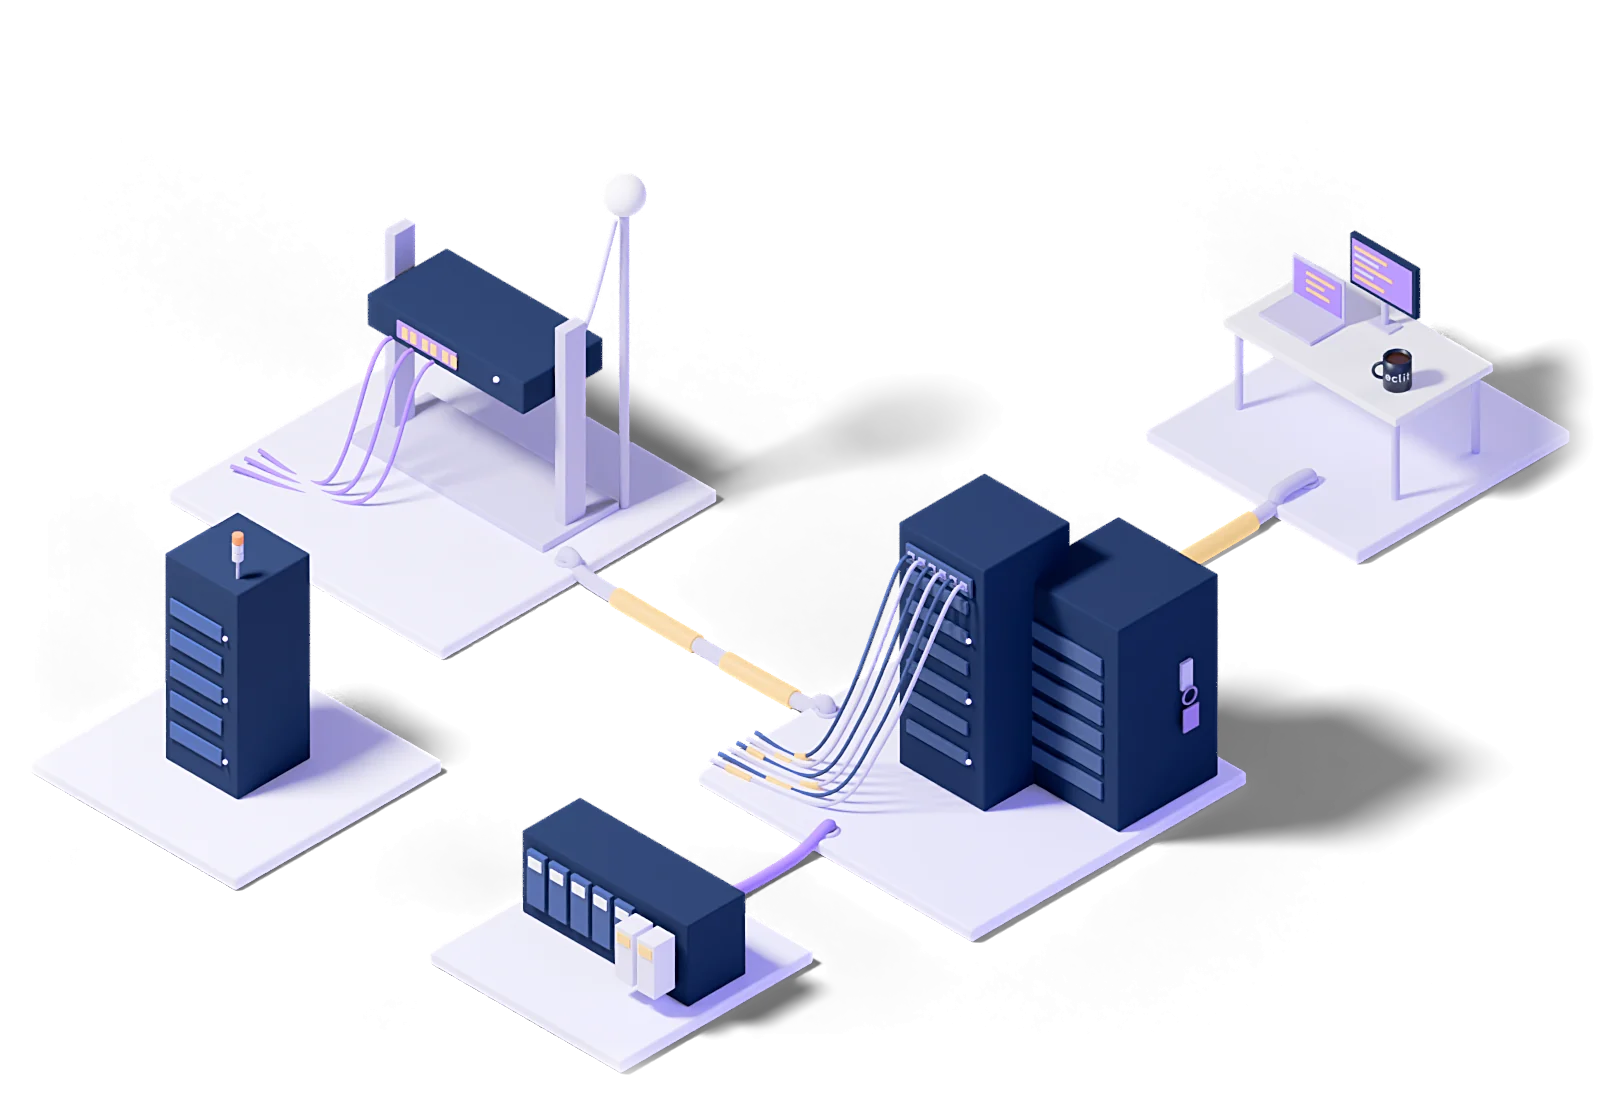
Server, network device, firewall, VPN and application logs collected on one platform. A log left on the server is the first thing deleted when that server is compromised.
Logs stored so they cannot be altered afterward, with access to the logs themselves also recorded. It is one of the first things an auditor asks about.
A retention period defined by policy for each record type. Records deleted because the disk filled up reflect capacity, not policy.
NTP across all systems. A drift of a few minutes makes reconstructing an incident timeline impossible.
Logs for a given date range retrieved within a reasonable time. Logs that sit in an archive and take three days to restore are not good enough in most scenarios.
Alerts built on log data for critical events: unauthorized access attempts, privilege escalation and configuration changes.
How it works
Every engagement follows the same five steps: baseline the current state, design the target model, roll out in stages, operate it, and improve against measurements.
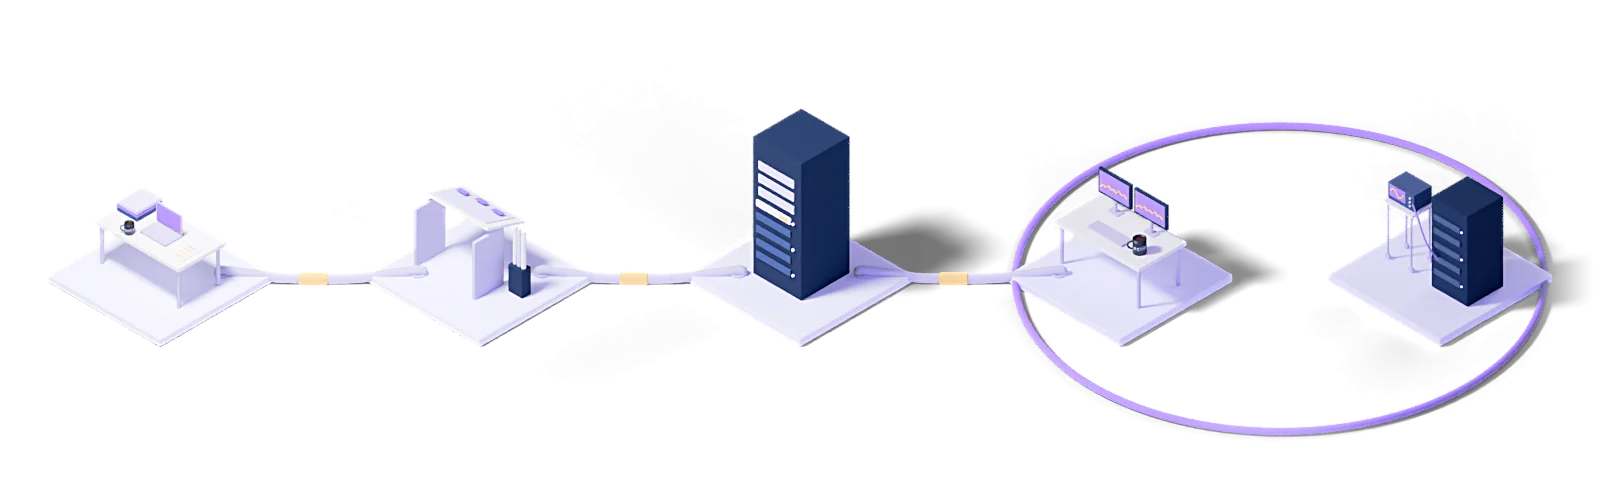
Assess
Baseline the current state, name the gaps and put the success criteria in writing.
Design
Architect the target operating model and the toolchain it needs.
Deploy
Implement, configure and validate in a staged rollout.
Operate
24/7 management with contracted response times and proactive monitoring.
Improve
Continuous improvement driven by metrics, incidents and changes in the business.
Every engagement runs under a written SLA: a commitment, not a best-effort promise.
Dedicated engineers who know your stack. No generalist help-desk tier in between.
Service reviews every two weeks, roadmap updates every quarter.
Who uses this
The industries we run Centralized Logging & Telemetry for.
The technologies we run this on
The concepts behind this service
- Logging
- Recording system and application events.
This section explains the technical terms used on this page. The definitions come from Eclit's own technology glossary, and each term links through to its full entry there.
The full technology glossary →Knowledge Hub
What we have written about running and managing technology, collected in one place.
What Is a Log? Log Records, Log Management and Retention
7 min readLog Retention Periods: Which Records to Keep and for How Long
4 min readDoes Türkiye's Cybersecurity Law Apply to You? The 15 Critical Infrastructure Sectors
5 min readEveryone Runs Prometheus: So Why Do We Still Hear About Incidents Late?
4 min readWhat Are SIEM and SOC? How They Differ and Work Together
9 min read01What is the difference between centralized and distributed logging?
With distributed logs, investigating an event means visiting every server one by one and takes hours. With a central setup a single query scans the whole estate. The difference shows up as time lost during an incident.
02Is there a standard for collecting telemetry?
OpenTelemetry has become the de facto standard, and its biggest advantage is vendor independence: changing tools does not mean rewriting the instrumentation. We recommend it for new builds.
03How do you control data volume?
Filtering at source, sampling and tiered retention. Filtering at source is the most effective: detail that is not needed is never sent. Every byte collected has both a cost and a retention period.
04Can you separate different teams' data?
Yes, through tenancy separation and role-based access. Keeping each team out of other teams' logs matters for both confidentiality and signal-to-noise.
05Can you migrate our existing setup?
Yes. We migrate between Elasticsearch, OpenSearch, Loki and commercial platforms; during the transition, both pipelines run in parallel for a period and data integrity is verified by comparison.
Let's work out where to start
Within two weeks you get it in writing: what works, what carries risk, and a prioritized roadmap.
Request a conversation