Reliability Friday 01: How to Measure PostgreSQL Replication Lag
The replica may be up, but how far behind is it? Measuring lag with pg_stat_replication, why zero rows is not zero lag, and deriving the threshold from RPO.
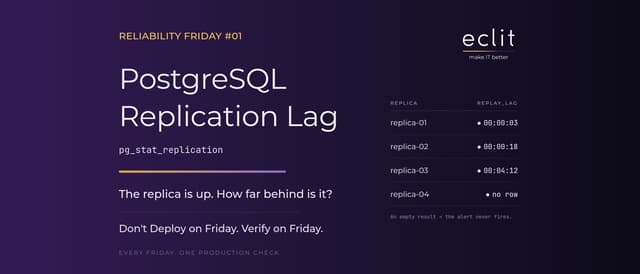
Short answer: A replica being up is not enough. Run on the primary, the pg_stat_replication view shows how far behind each replica is, at three separate stages. The threshold comes from your RPO target; under 30 seconds is normal, while over 5 minutes, or lag that climbs steadily, should trigger an alert. The most dangerous result, though, is no rows at all.
Don't Deploy on Friday. Verify on Friday.
This week's check
To see the lag between primary and replica, run the query on the primary:
SELECT
  application_name,
  client_addr,
  state,
  sync_state,
  write_lag,
  flush_lag,
  replay_lag,
  pg_wal_lsn_diff(pg_current_wal_lsn(), replay_lsn) AS replay_bytes
FROM pg_stat_replication
ORDER BY replay_lag DESC NULLS LAST;
Expected output
The query returns one row per replica. A replay_lag: 00:04:12 result means the replica is roughly 4 minutes 12 seconds behind the primary.
The three columns measure three different stages: write_lag measures the data reaching the replica, flush_lag the data being written to disk and replay_lag the data being applied. The difference between them tells you where the bottleneck is. If write_lag is low but replay_lag is high, the problem is not the network but the speed at which the replica applies WAL, usually because a long-running query is blocking replay, or because of disk IO.
The last column gives the same distance in bytes. Time is the measure for humans; bytes are the more reliable measure for an alert threshold, because when write traffic is light the lag in seconds can look small while the accumulated WAL is large.
Zero rows is not zero lag
pg_stat_replication holds one row per WAL sender process. When a replica loses its connection, that process exits and the row disappears from the view entirely.
The consequence: an alert built on replay_lag > 5 minutes never fires when the replica goes down. There is no row to compare, the query quietly returns empty, and the on-call dashboard stays green. So the real check is a replica count:
SELECT count(*) FROM pg_stat_replication WHERE state = 'streaming';Write down the number of replicas you expect and alert when the count drops below it. The lag alert comes second.
When to act
There is no single correct threshold; it comes from your RPO target. As a general reference:
Under 30 seconds: normal, keep monitoring.
30 seconds to 5 minutes: investigate the cause (write load, checkpoint frequency, network bottleneck).
Over 5 minutes, or climbing steadily: revisit failover and reporting decisions; an alert should fire.
An idle primary produces false alarms
The second common method, run on the replica side, is now() - pg_last_xact_replay_timestamp(). It is useful, but it has a trap: the function returns the timestamp of the last transaction replayed. If the primary is committing nothing, overnight or on the weekend, there is no new transaction to replay and that difference keeps growing. The alarm goes off while replication is working perfectly.
Use both measures together: pg_stat_replication knows how far ahead the primary actually is; pg_last_xact_replay_timestamp() does not.
The risk
Heavy write traffic, a network bottleneck or frequent checkpoints all increase lag. As lag grows, a replica that appears to be running drifts further from current data. That has three consequences: data loss during failover, stale data in reports, and SLA breaches.
The second is the most insidious. Moving reporting load to the replica is a common practice and a correct one, but if lag is not monitored a business unit may be looking at yesterday's data without knowing it. This is the kind of failure nobody opens an incident for.
Automate it
Rather than running this query by hand every Friday, collect the pg_replication_lag metric with the Prometheus postgres_exporter and set a threshold-based alert in Grafana. Write two rules together: a lag threshold and a replica-count threshold. Teams that set only the first tend to notice a downed replica days later. We covered why alerts arrive late in everyone runs Prometheus.
The weekly manual check is useful until automation is in place; it is not the end state.
Eclit note
The mistake we see most often in replication monitoring is watching a single metric. Lag in seconds, distance in bytes, and the count of connected replicas catch three different failures, and none substitutes for another. Setting up all three is ten minutes of work; in our database platform engineering practice, we start with that trio as standard.
This article was first published on the Eclit Engineering Medium account.