24/7 Monitoring
Managed 24/7 monitoring (NOC) with real human response. We monitor your entire estate (on-premises, cloud and hybrid) so you can focus on running your business.
What we deliver
Round-the-clock monitoring of your entire infrastructure estate (servers, network, storage, cloud and virtualization), with real-time alerting and human-led response.
Every alert triaged by experienced operations engineers, not just routed to your inbox. False positives filtered, genuine issues investigated and resolved or escalated with full context.
Continuous visibility of network health, bandwidth utilization, latency and packet loss across your WAN, LAN and cloud connectivity, with threshold alerting and capacity planning.
Unified monitoring across on-premises, cloud (AWS, Azure, GCP) and hybrid environments, with one view of everything, wherever your infrastructure runs.
Monthly operational performance reports (uptime trends, incident analysis, capacity metrics and improvement recommendations) that give leadership a clear view of IT health.
Monitor resource utilization trends and identify capacity constraints before they cause performance issues, planning upgrades and expansions ahead of demand.
How it works
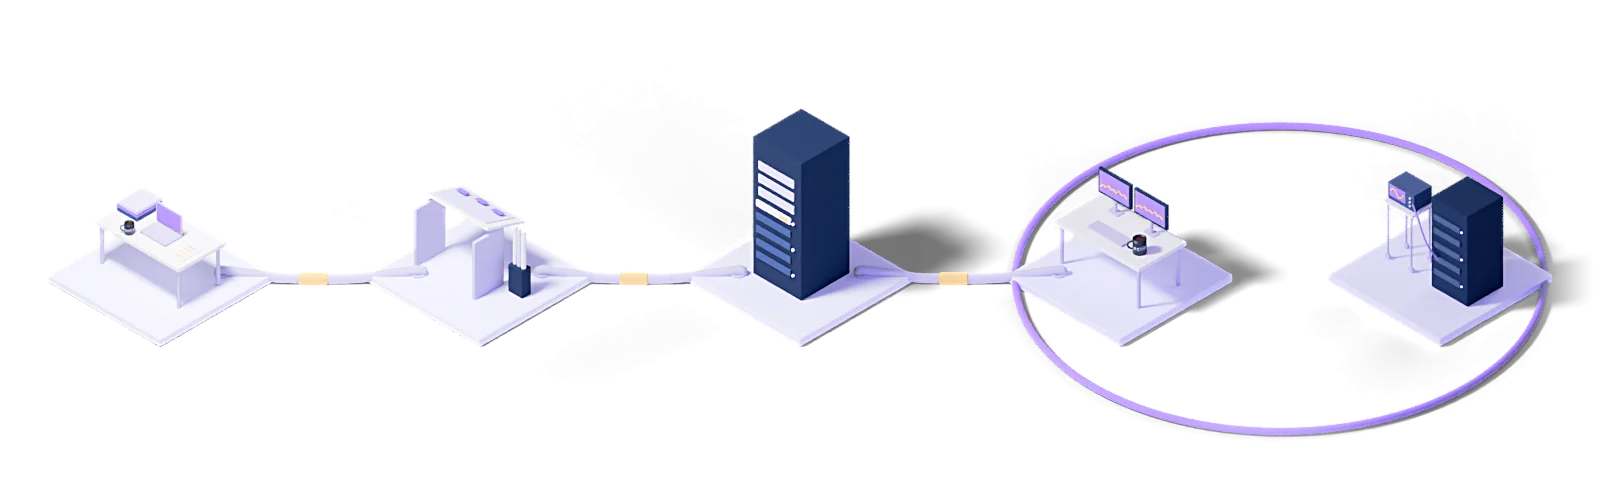
Every engagement follows the same five steps: baseline the current state, design the target model, roll out in stages, operate it, and improve against measurements.
Assess
Baseline the current state, name the gaps and put the success criteria in writing.
Design
Architect the target operating model and the toolchain it needs.
Deploy
Implement, configure and validate in a staged rollout.
Operate
24/7 management with contracted response times and proactive monitoring.
Improve
Continuous improvement driven by metrics, incidents and changes in the business.
Every engagement runs under a written SLA: a commitment, not a best-effort promise.
Dedicated engineers who know your stack. No generalist help-desk tier in between.
Service reviews every two weeks, roadmap updates every quarter.
Who uses this
The industries we run 24/7 Monitoring for.
The technologies we run this on
Knowledge Hub
What we have written about running and managing technology, collected in one place.
What Is Uptime and How Is It Calculated? 99.9% vs 99.99%
8 min readWhat Is APM? How Application Performance Monitoring Works
5 min readReliability Friday 03: How to Build an Incident Escalation Matrix
4 min readEveryone Runs Prometheus: So Why Do We Still Hear About Incidents Late?
4 min readReliability Friday 01: How to Measure PostgreSQL Replication Lag
4 min readHow to Run a Disaster Recovery Failover Test That Proves Something
4 min read01What does your 24/7 monitoring and operations support cover?
We monitor your servers, network, storage, virtualization and cloud (AWS, Azure, GCP) around the clock. An on-call engineer reviews every alert and responds to it; false alarms are filtered out and real problems get fixed. Monthly performance reports and capacity planning are part of the service.
02How long does monitoring take to set up?
Basic infrastructure monitoring is up within days; meaningful alert thresholds take weeks, because it takes time to learn what normal looks like. Thresholds set on day one are inevitably noisy.
03How do you prevent alert fatigue?
By requiring every alert to have an action. An alert nobody acts on is just noise, so we change its threshold or remove it. We also track alert volume as a metric.
04What should we monitor?
What your users experience. CPU utilization is a symptom; what needs measuring is response time, error rate and whether the business transaction completes. A server can look healthy while the user gets no service.
05Does 24/7 monitoring mean 24/7 response?
No, they are separate services. Monitoring produces the alert; response needs an on-call team. An alert that fires at night but is only read in the morning loses most of its value.
06Can you use our existing monitoring tool?
Yes. We work with Zabbix, Prometheus, Grafana, PRTG and vendor tooling. Configuring the existing tool properly usually produces results faster than replacing it.
Let's work out where to start
Within two weeks you get it in writing: what works, what carries risk, and a prioritized roadmap.
Request a conversation