Reliability Friday 10: Why a Firewall Drops Packets at 30% Bandwidth
Firewall capacity is not just Gbps; packet rate, connection rate, session table, inspection and packet buffer are separate limits. Find out which one is full.
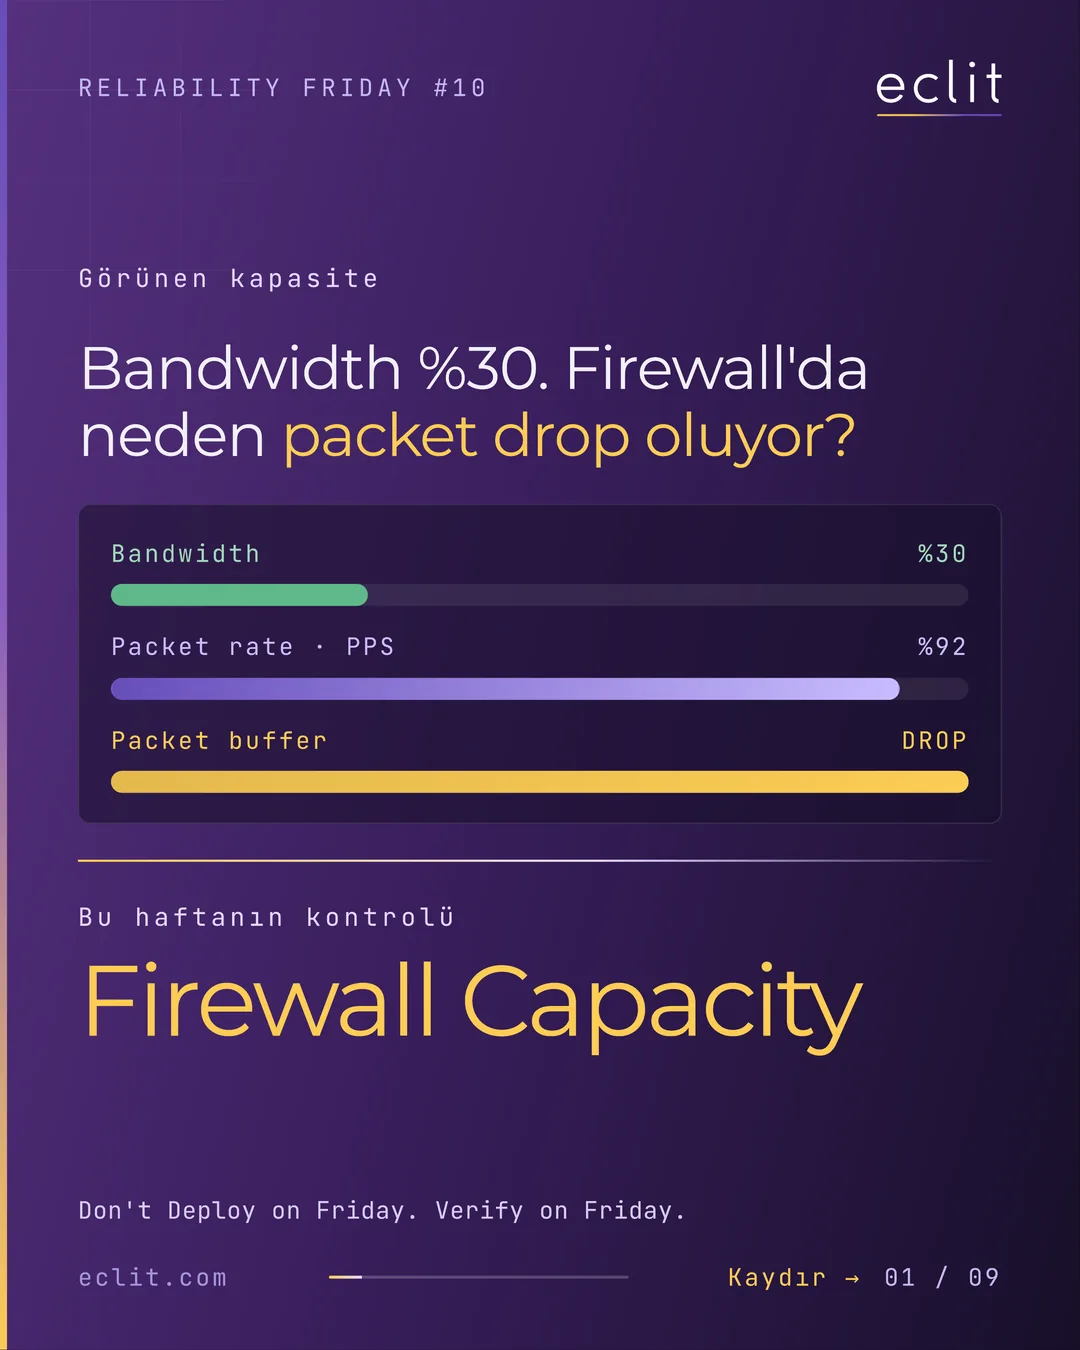
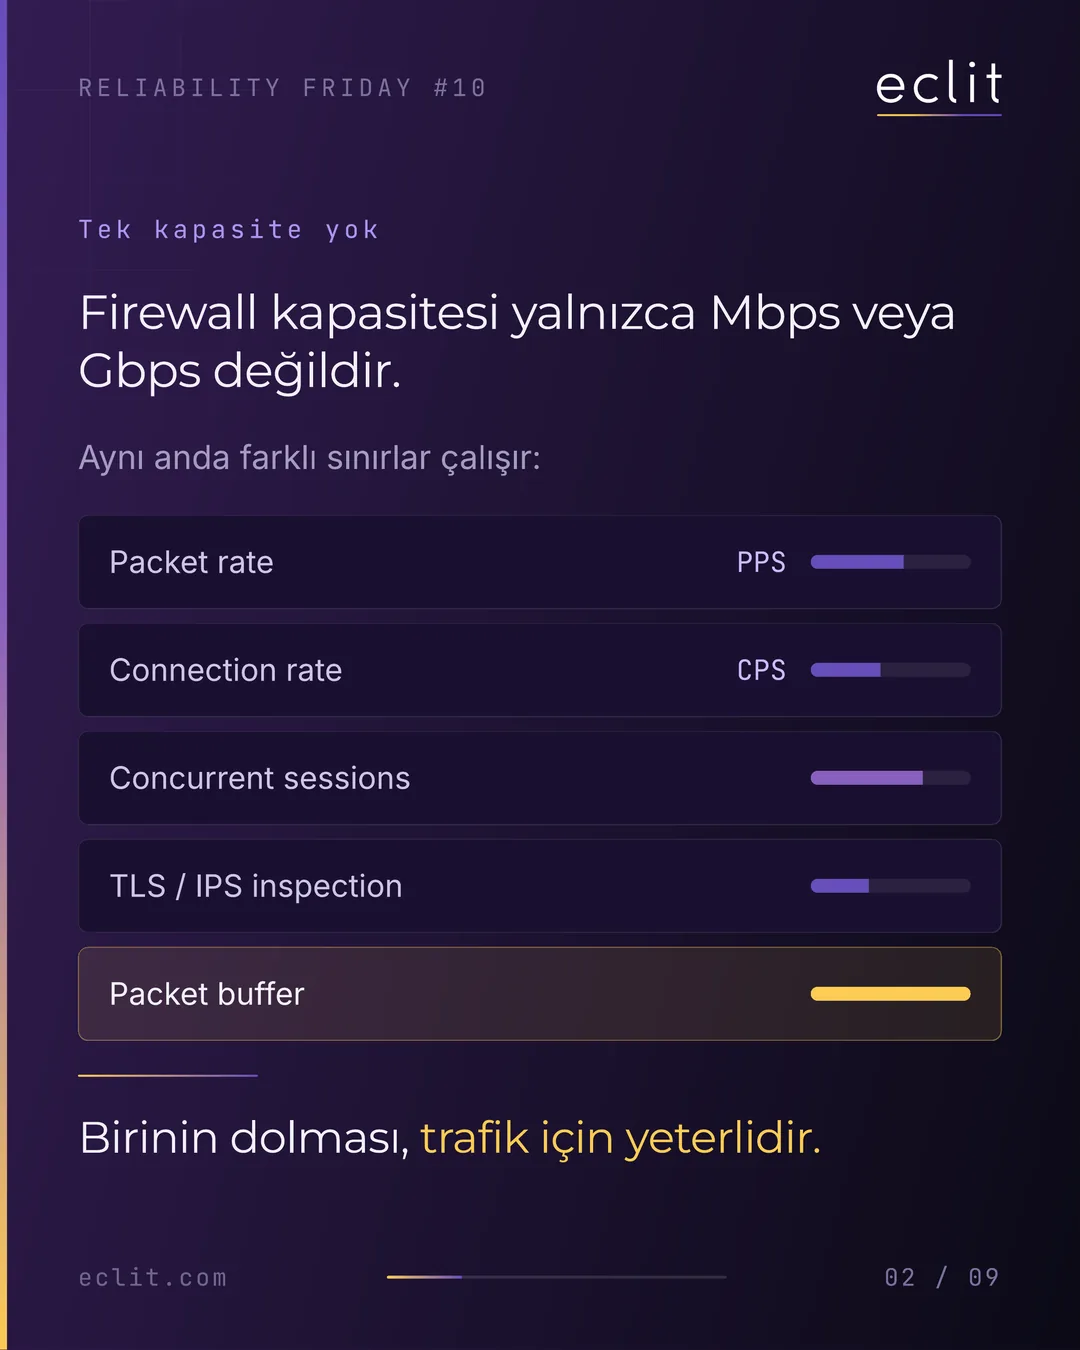
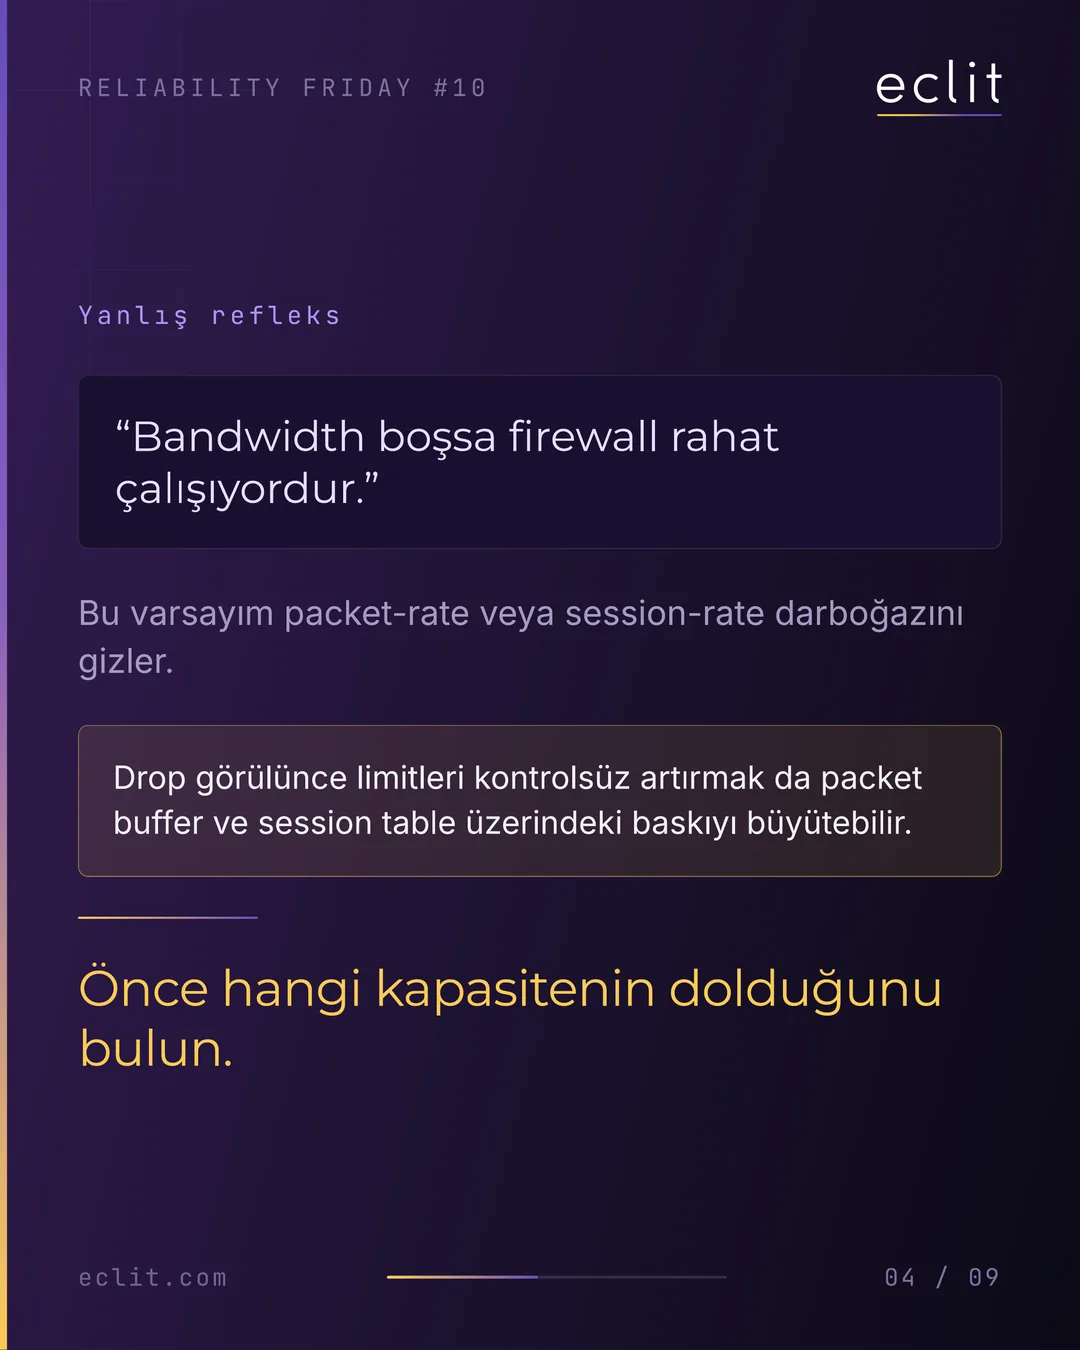
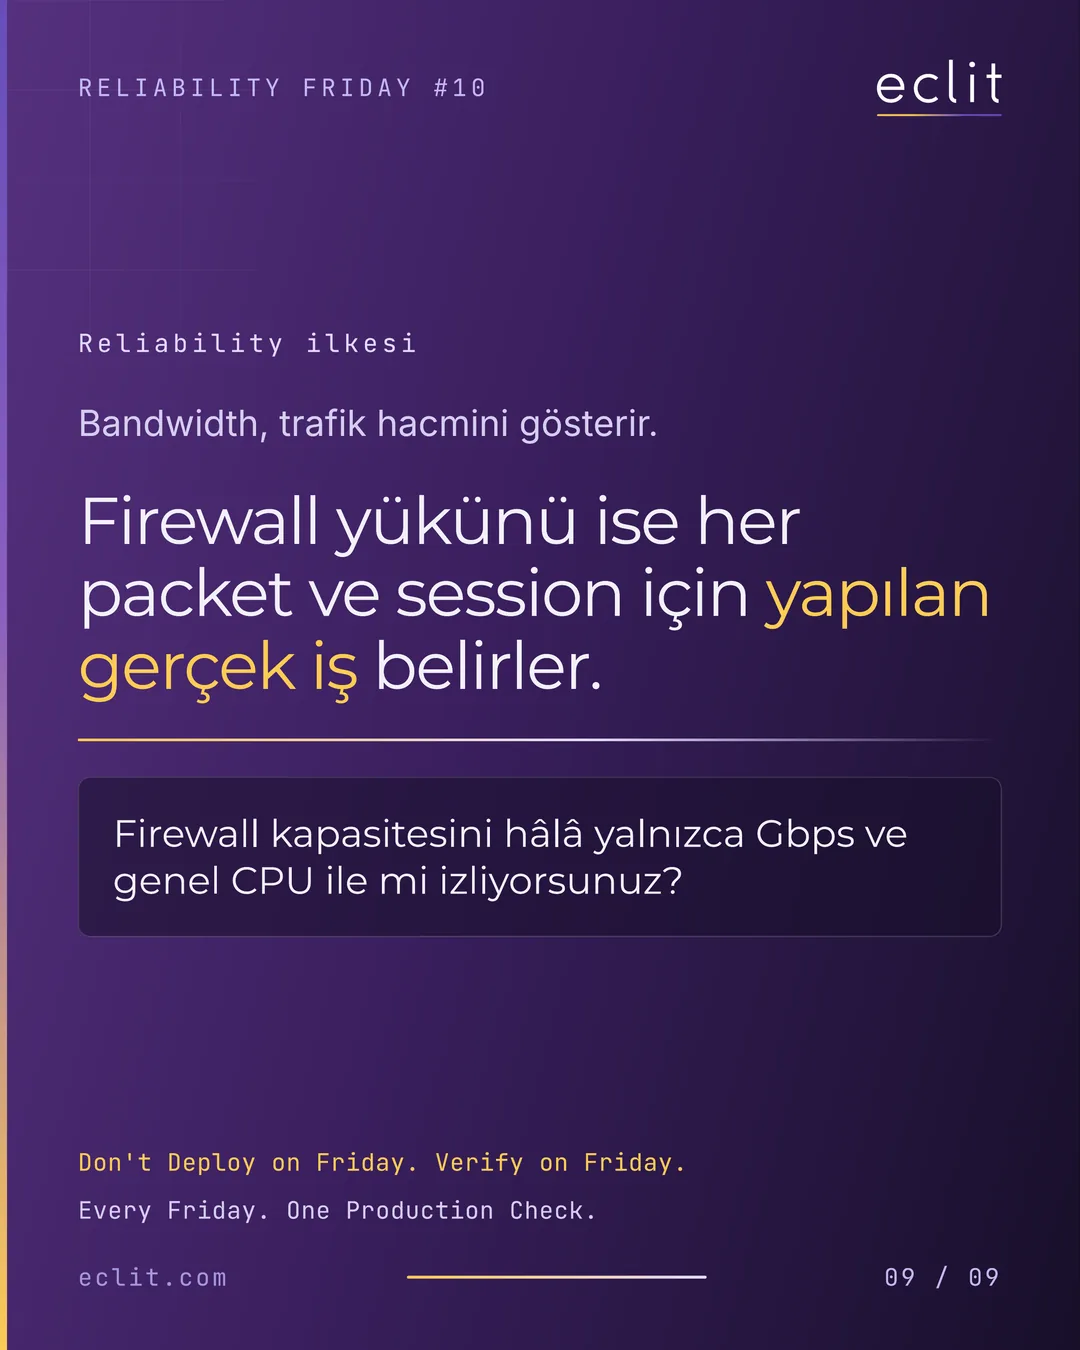
Short answer: A firewall can drop packets while bandwidth sits at 30%, because firewall capacity is not just Mbps or Gbps. Several limits apply at the same time: packet rate (PPS), connection rate (CPS), concurrent sessions, TLS / IPS inspection and the packet buffer. Any one of them filling up is enough for traffic to suffer. The assumption "bandwidth is free, so the firewall is fine" hides a packet-rate or session-rate bottleneck. First find out which capacity is full.
Don't Deploy on Friday. Verify on Friday.
This week's check
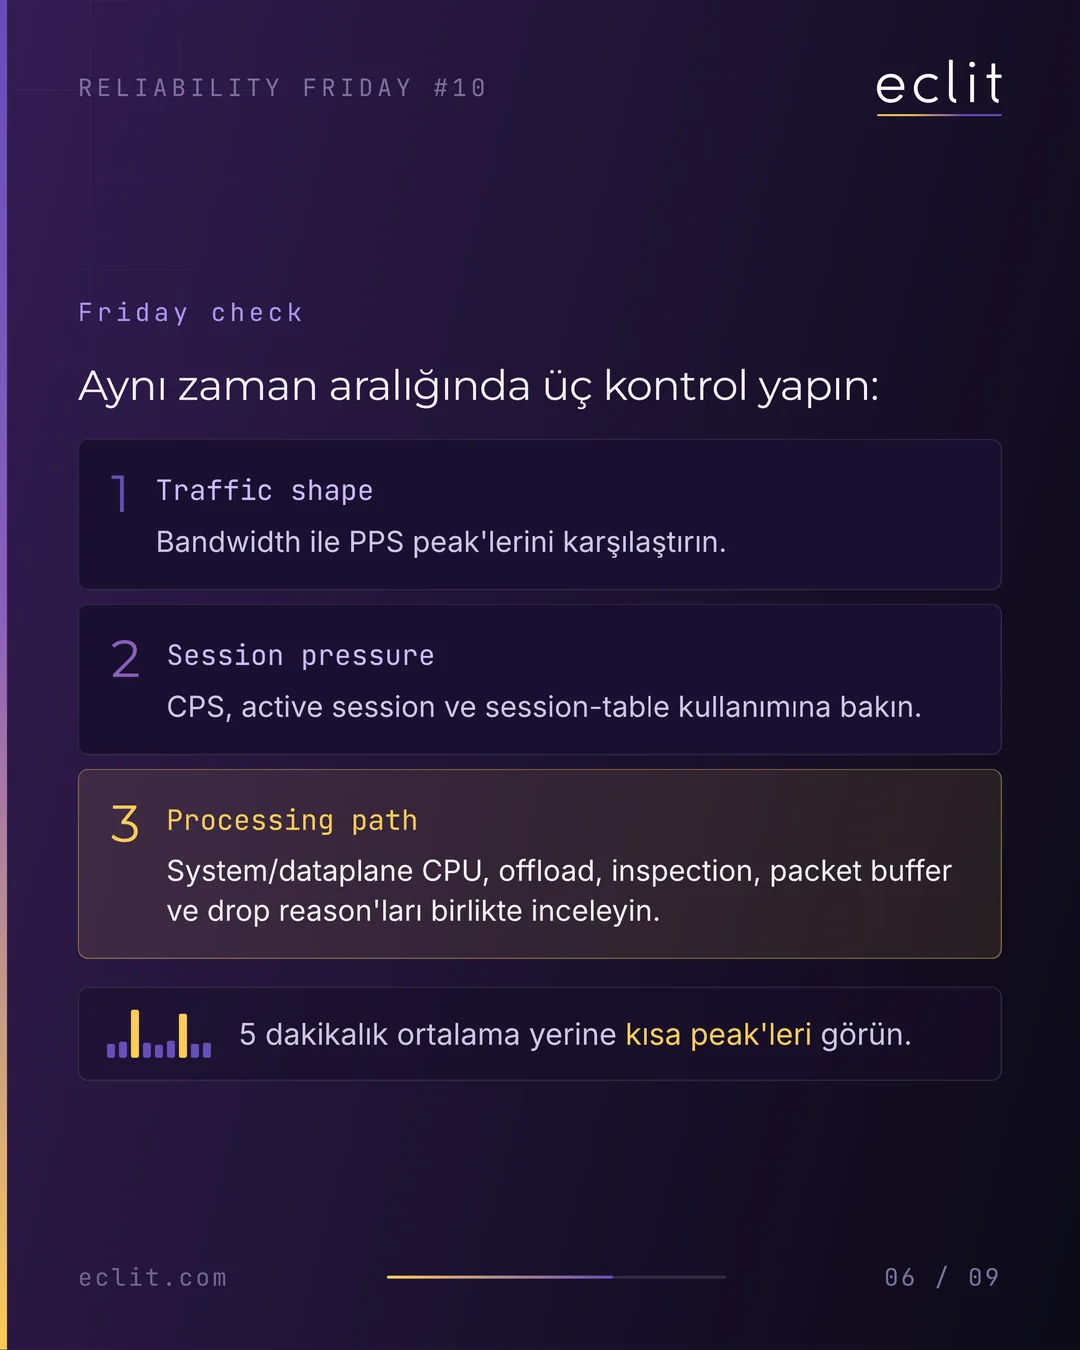
Run three checks over the same time window, and look at short peaks rather than 5-minute averages.
1. Traffic shape
   Compare bandwidth with PPS peaks.
2. Session pressure
   Look at CPS, active sessions and session-table usage.
3. Processing path
   Review system / dataplane CPU, offload, inspection,
   packet buffer and drop reasons together.
Are you still watching firewall capacity only through Gbps and overall CPU?
Expected output
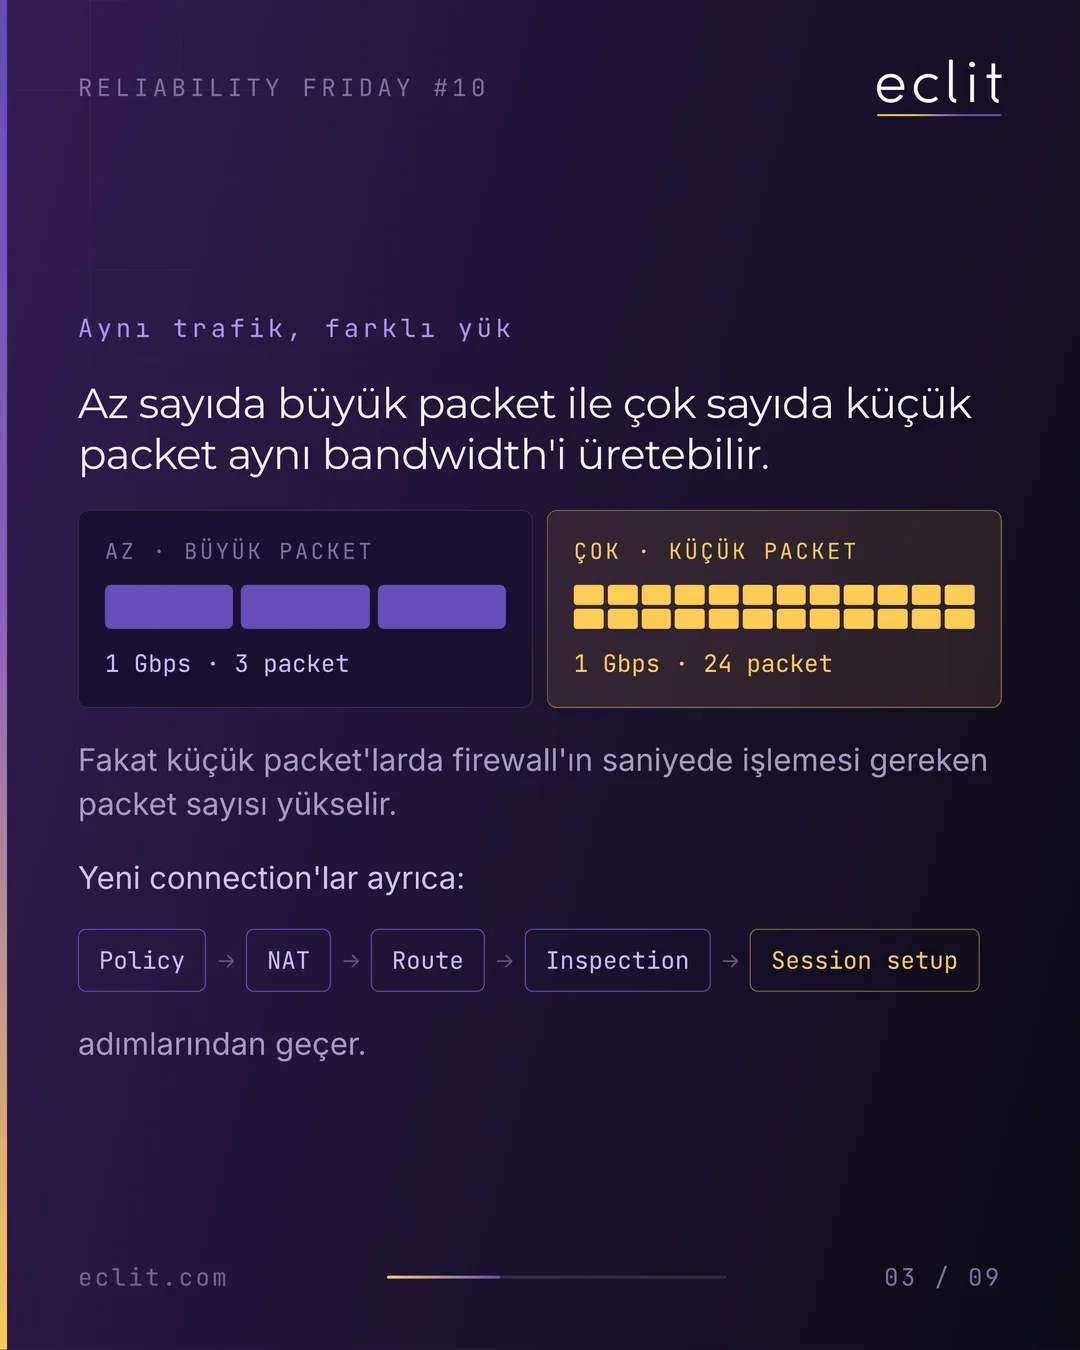
The same traffic produces a different load. A few large packets and many small packets can produce the same bandwidth; in the carousel's example, 1 Gbps is filled by three large packets as well as by twenty-four small ones. But with small packets, the number of packets the firewall has to process per second goes up. New connections also pass through policy, NAT, route, inspection and session setup. That is why PPS and CPS peaks can fill a capacity while the bandwidth graph stays flat.
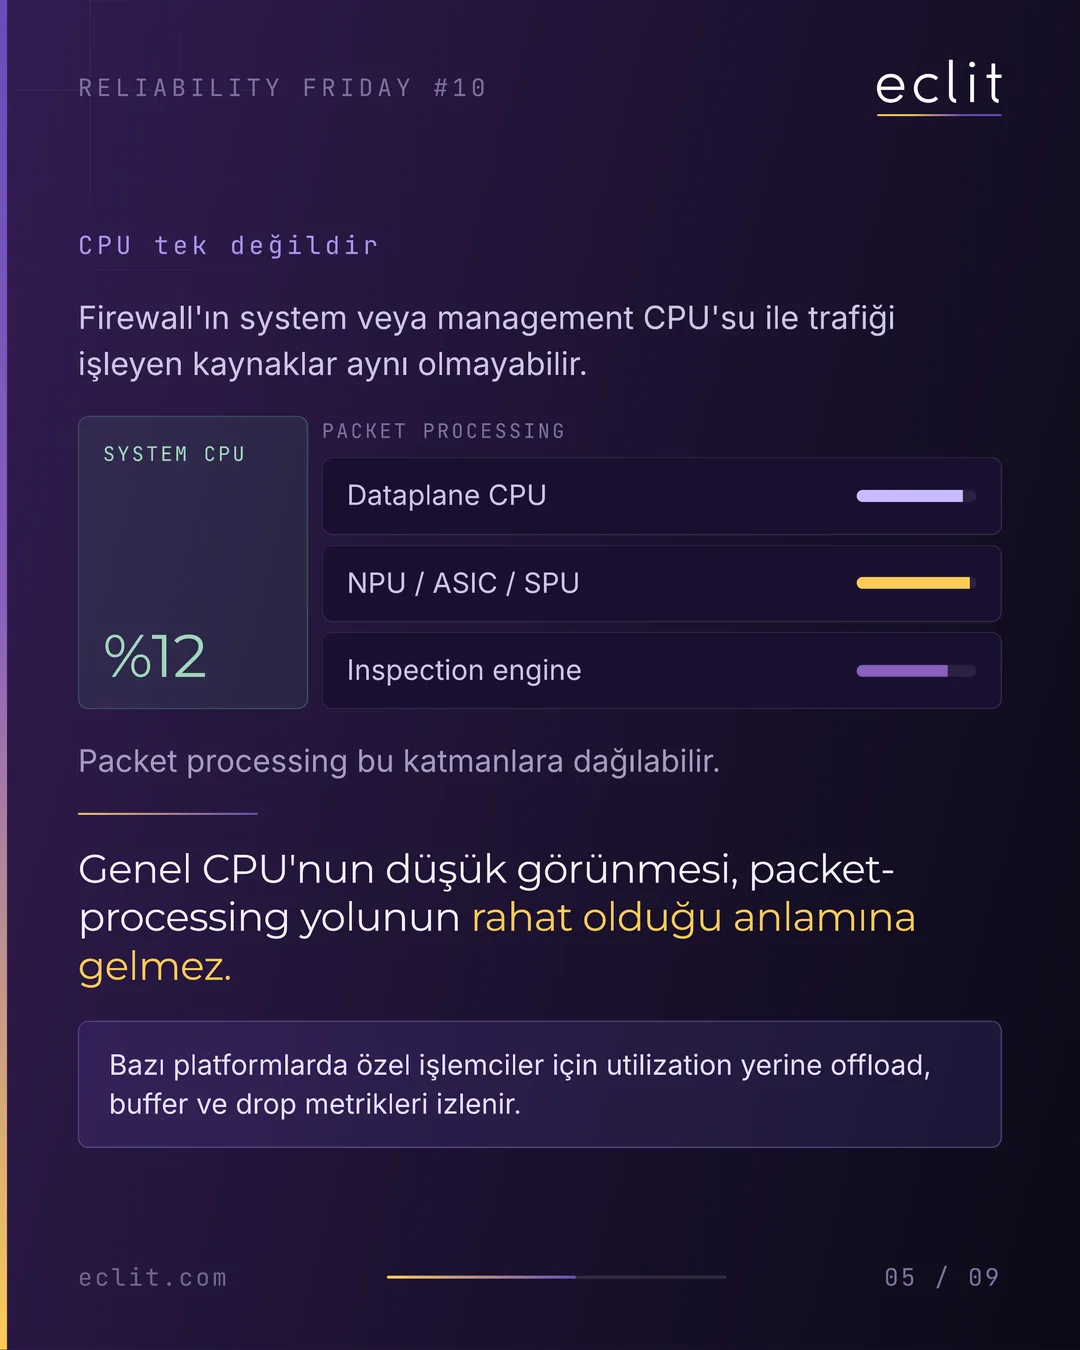
CPU is not one thing. The firewall's system or management CPU and the resources that process traffic may not be the same; packet processing can be spread across the dataplane CPU, NPU / ASIC / SPU and the inspection engine. A low overall CPU figure does not mean the packet-processing path is relaxed. On some platforms, dedicated processors are watched through offload, buffer and drop metrics rather than utilization.
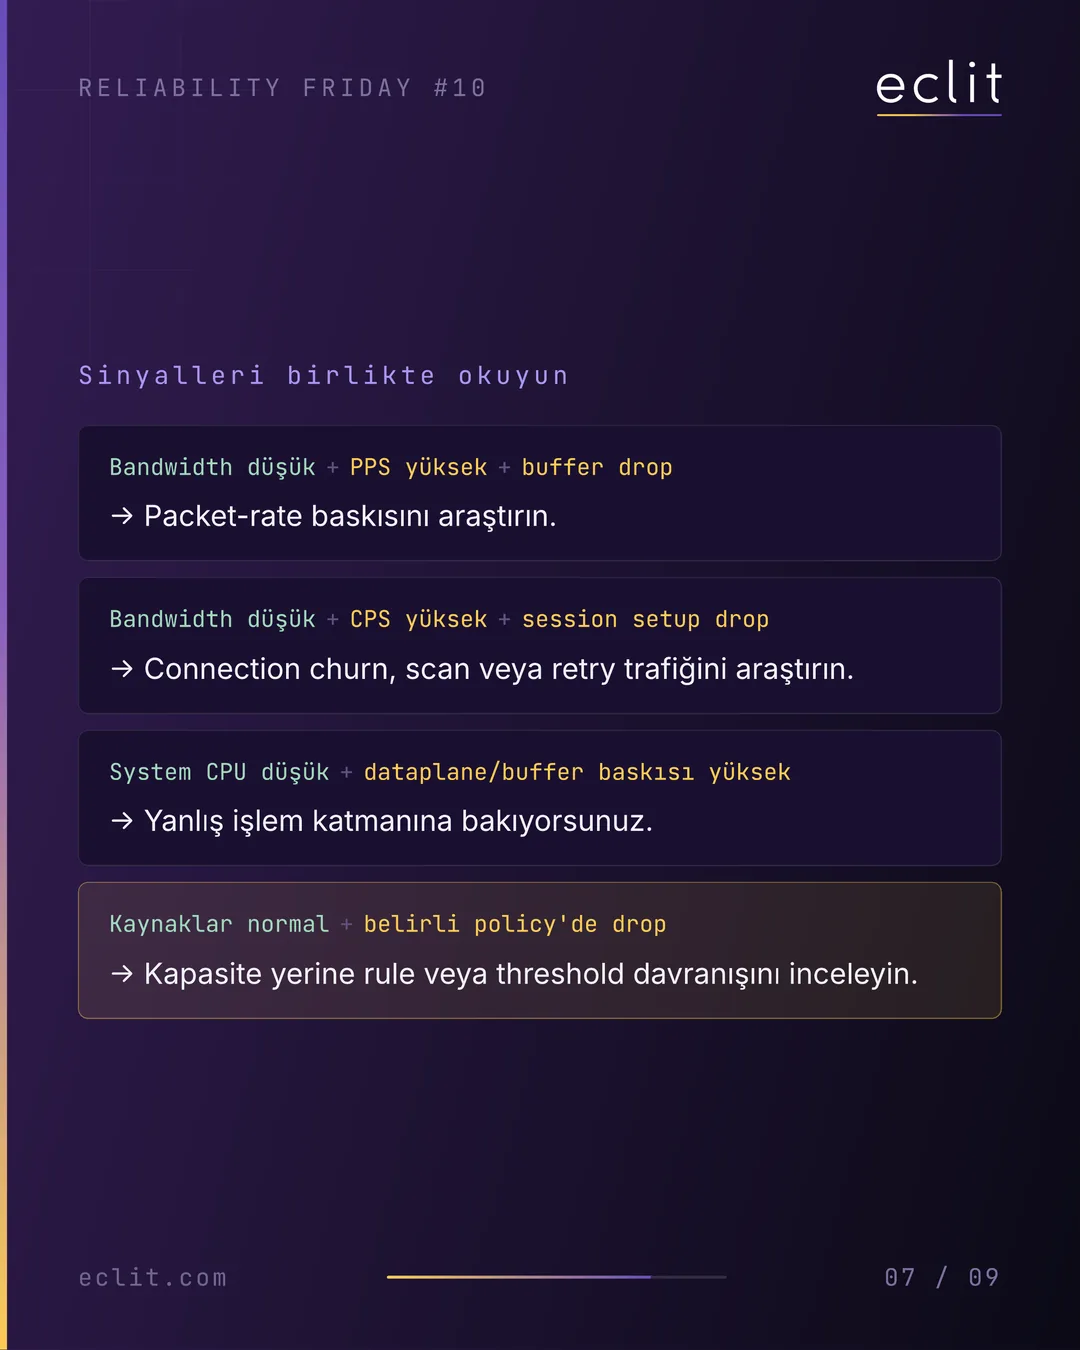
Read the signals together:
- Low bandwidth + high PPS + buffer drops: investigate packet-rate pressure.
- Low bandwidth + high CPS + session setup drops: investigate connection churn, scan or retry traffic.
- Low system CPU + high dataplane / buffer pressure: you are looking at the wrong processing layer.
- Resources normal + drops on a specific policy: look at rule or threshold behavior instead of capacity.
When to act
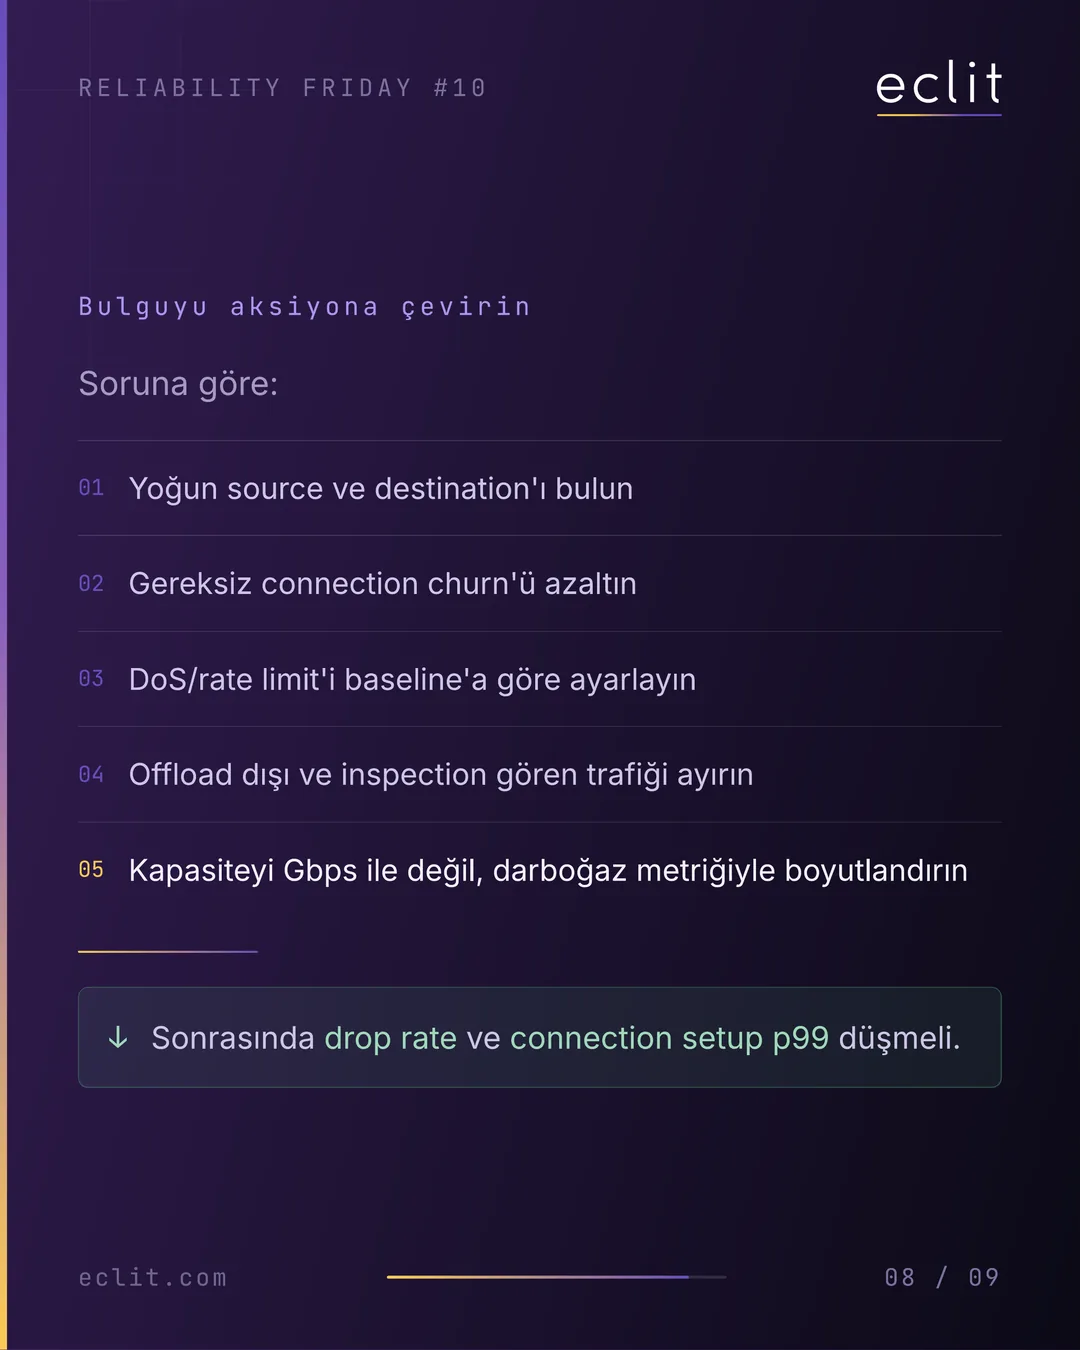
The threshold depends on your own baseline; what tells you a capacity is full is not a percentage but drops. If you see packet buffer drops, session setup drops or drops on a specific policy, that capacity is full, whatever the bandwidth shows. Depending on the problem:
- Find the busy sources and destinations.
- Reduce unnecessary connection churn.
- Tune DoS / rate limits against your baseline.
- Separate traffic that is not offloaded and traffic that goes through inspection.
- Size capacity by the bottleneck metric, not by Gbps.
Afterwards, the drop rate and connection setup p99 should come down.
Risk
Raising limits uncritically once drops appear can also increase the pressure on the packet buffer and the session table. The wrong reflex is to grow the wrong capacity: more bandwidth does not fix a PPS bottleneck, and a bigger session table does not remove the source of connection churn. Every measure taken before you know which capacity is full spends money and maintenance windows in the wrong place.
Automate it
A weekly manual check is a starting point, not the destination. Put PPS, CPS, session-table usage, dataplane / NPU load, packet buffer and drop reason metrics on the same dashboard as bandwidth; watch peaks over short intervals rather than 5-minute averages, and alert when drops begin. Building that dashboard falls within our observability and performance and capacity analytics services; running the firewall itself falls within network security.
Eclit note
Bandwidth shows traffic volume. Firewall load is set by the real work done for every packet and session.
In the previous post in this series we counted how load balancer retries multiply backend traffic; retry traffic is one of the sources of this week's CPS pressure. For the basics of what a firewall does, see What is a firewall?.
Every Friday. One Production Check.